Profiling a CoreCLR application with dotMemory
I had ported an application over to CoreCLR (that’s a whole other blog post), along with my colleague James Humphries put it in a docker image and sat back and watched it do its thing. After 6 hours of running the docker container had crashed. Ah nuts we thought, so pulled up the logs from docker and the last line looked like this 2016-02-10T20:18:31.728783069Z Killed. I’m pretty sure when you have a log entry with Killed in it, things can’t be good. To the interweb…
I opened up the CoreFX repository on Github to search for the term Killed and there were 2 comments but nothing that was logged out anywhere. I then Googled for docker and killed and there was an entry that someone else had spotted on their container and the feedback was essentially it was probably out of memory.
I had spotted when I was debugging the appliation that memory usage was creeping up relatively slowly but assumed all would be ok when garbage collection kicked in. Well it seems its true what they say about assumptions as running it for 6 hours caused the container to be killed. I had mentioned to Matt Ellis, he of Jetbrains fame, a few months ago that having profiling tools such as dotMemory & dotTrace would be awesome for apps running on Linux. Last I heard there may be plans to have a remote agent that could run on Linux and this would send the info back to dotMemory which would run on Windows as its all in WPF I believe. Anyhow he pointed me to a blog post JB had done. This illustrated dotMemory profiling a *.exe that had been built for CoreCLR but I wanted to do it from Visual Studio and not have to produce a binary. Remeber CoreCLR apps don’t produce binaries unless you explicitly tell dnx/dotnet cli to do so. Anyhow long story short, we couldn’t get VS to launch the startup project and monitor my app. I assume they will solve this issue in the long run.
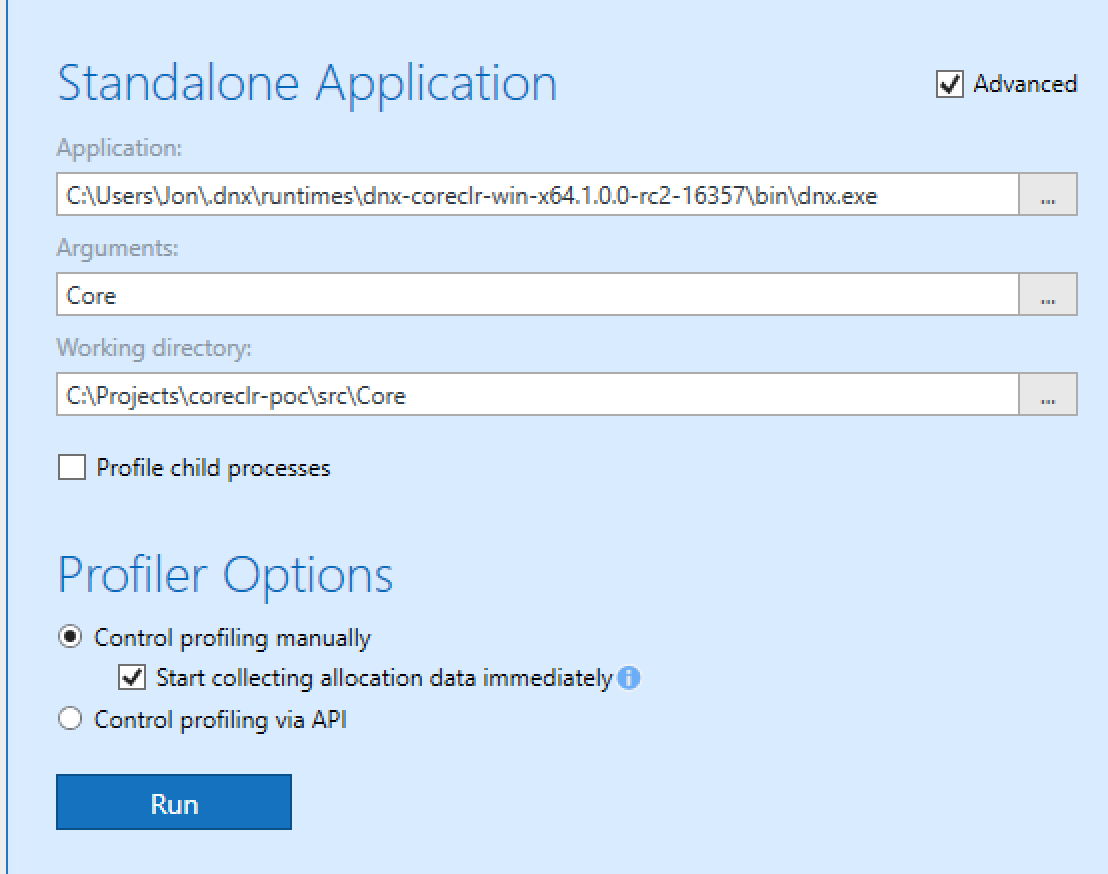
To get it working, we opened dotMemory and told it to profile a standalone application. That application was dnx.exe. Depending on your runtime target on Windows this executable will either be in C:\Program Files\DNX\runtimes or C:\Users\[USERNAME]\.dnx\runtimes. The next thing to do is click the Advanced option. Here you can enter any arguments which in this case it will be the command you use in project.json to start your application. The final option you have is the working directory. For me this was where the source code was. So you should have something looking like this:
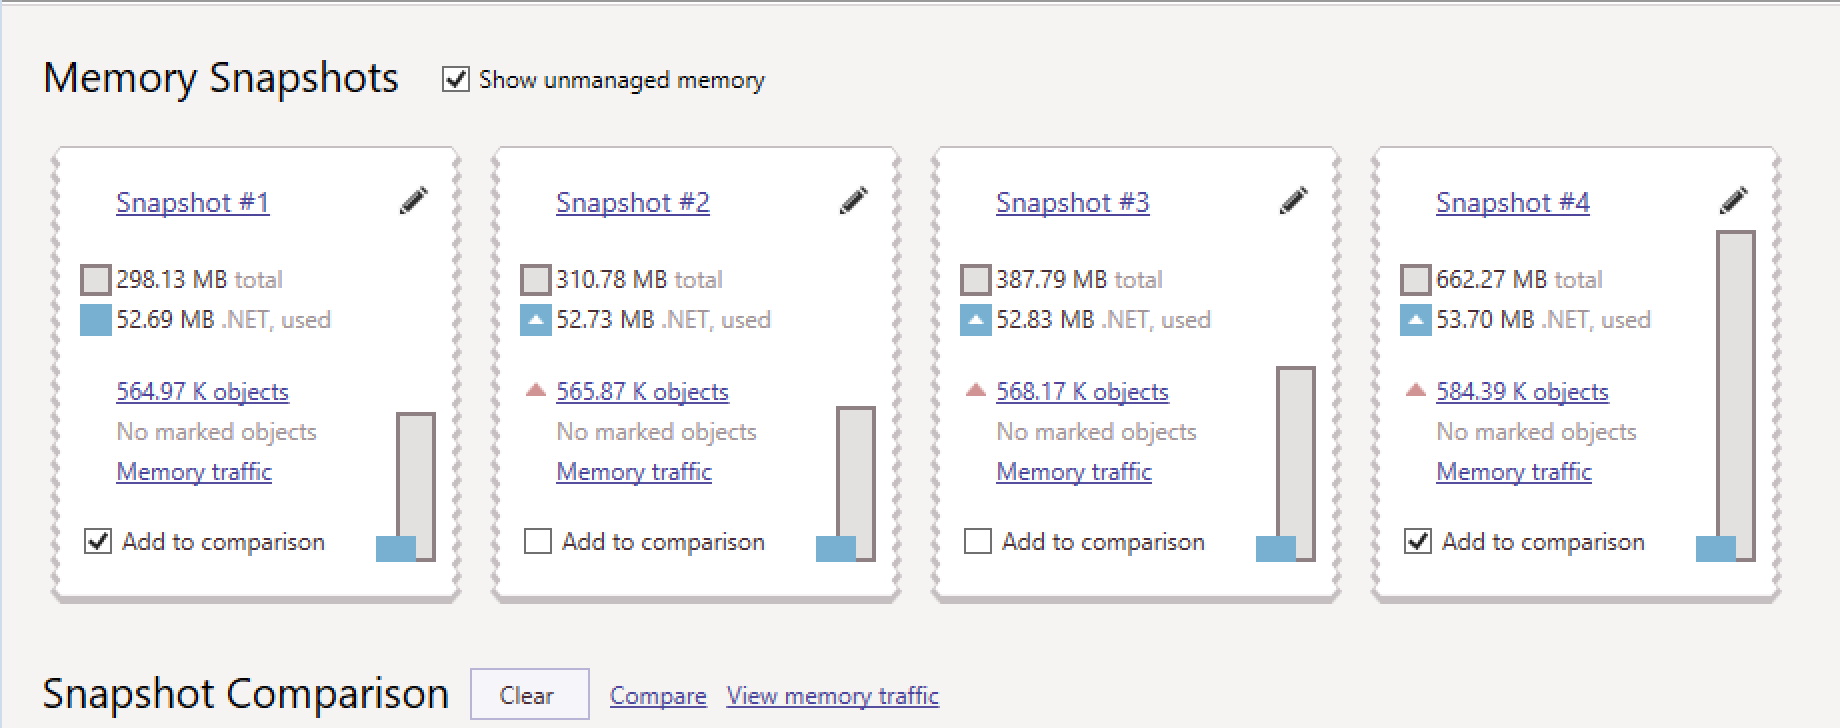
Once you click Run it will start you application up and begin doing its thing. What we did was to create a snapshot as soon as the app seemed to have started up, wait 60secs, take another snapshot, wait 120 seconds and repeat. You can then compare the snapshots by selecting the snapshots checkbox and then clicking compare. You can then see the differences.
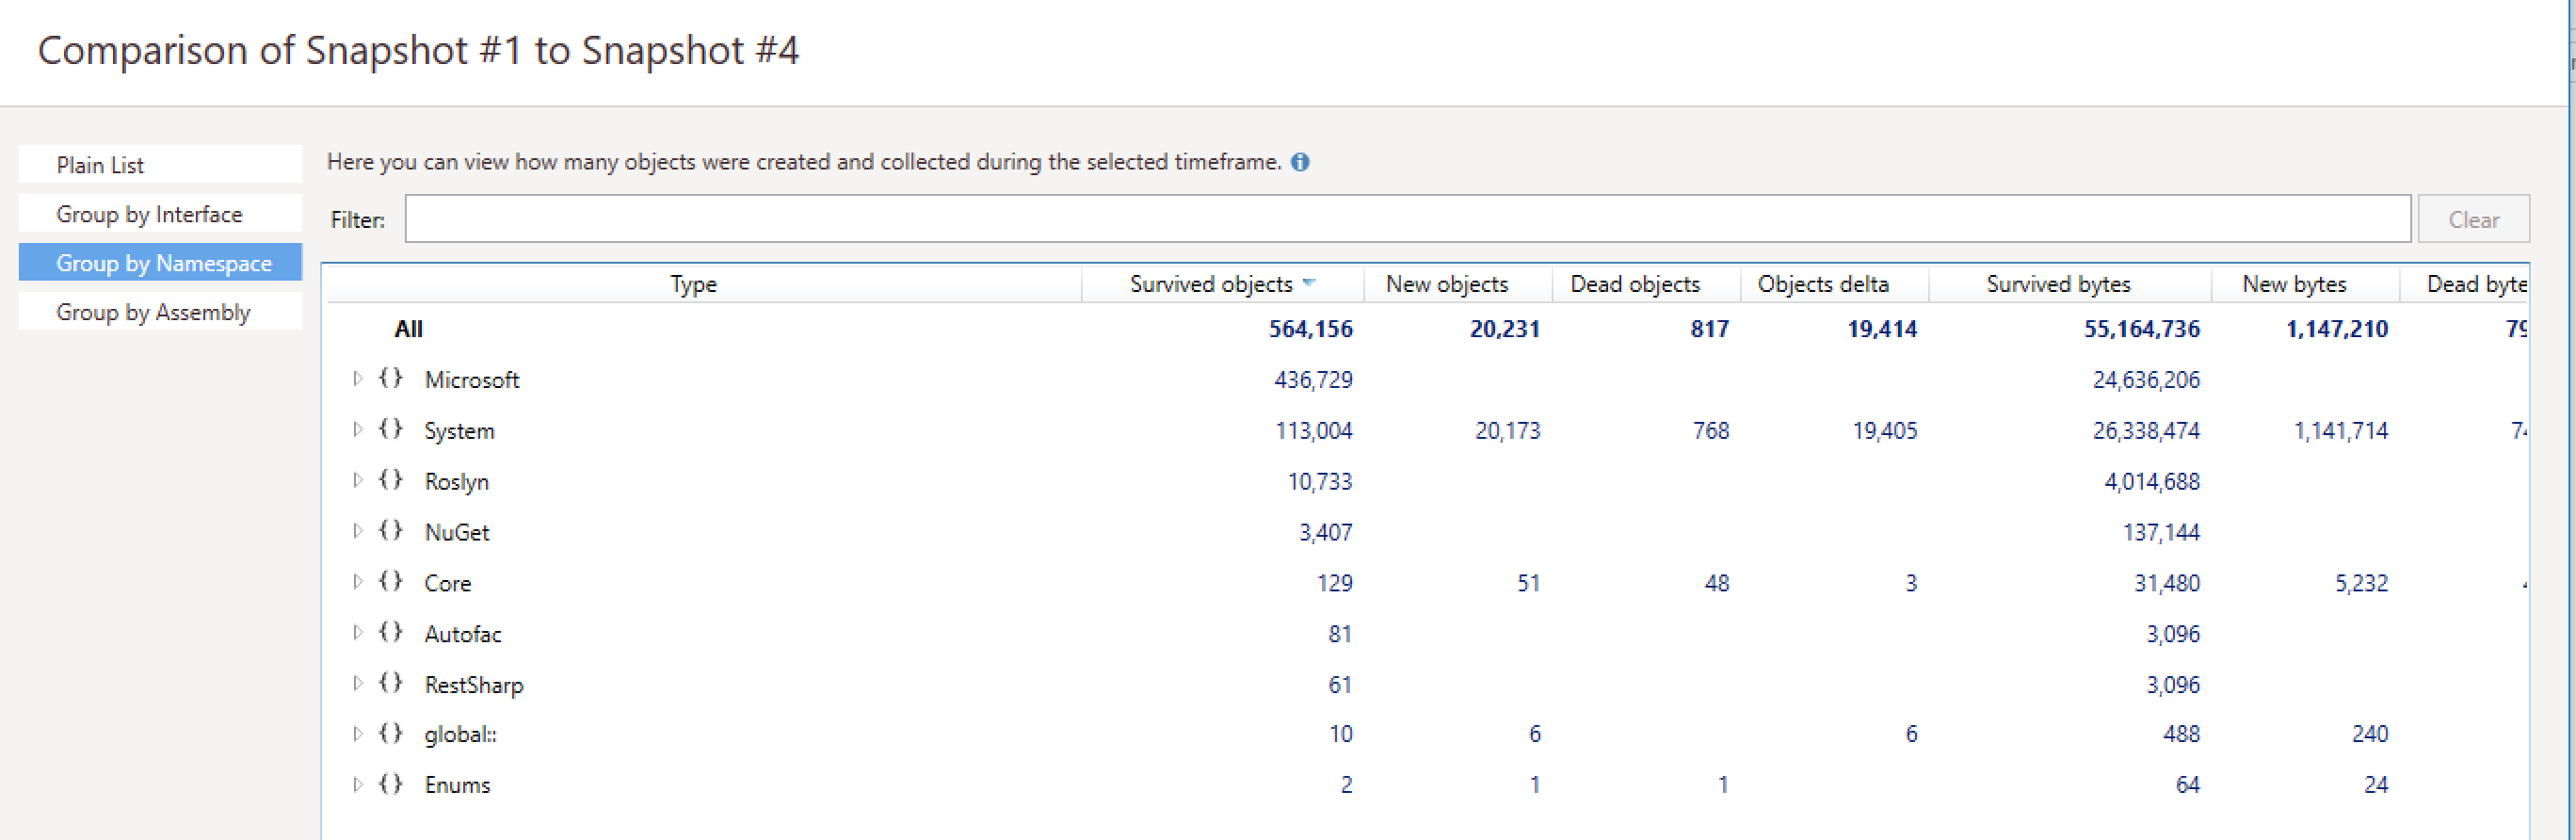
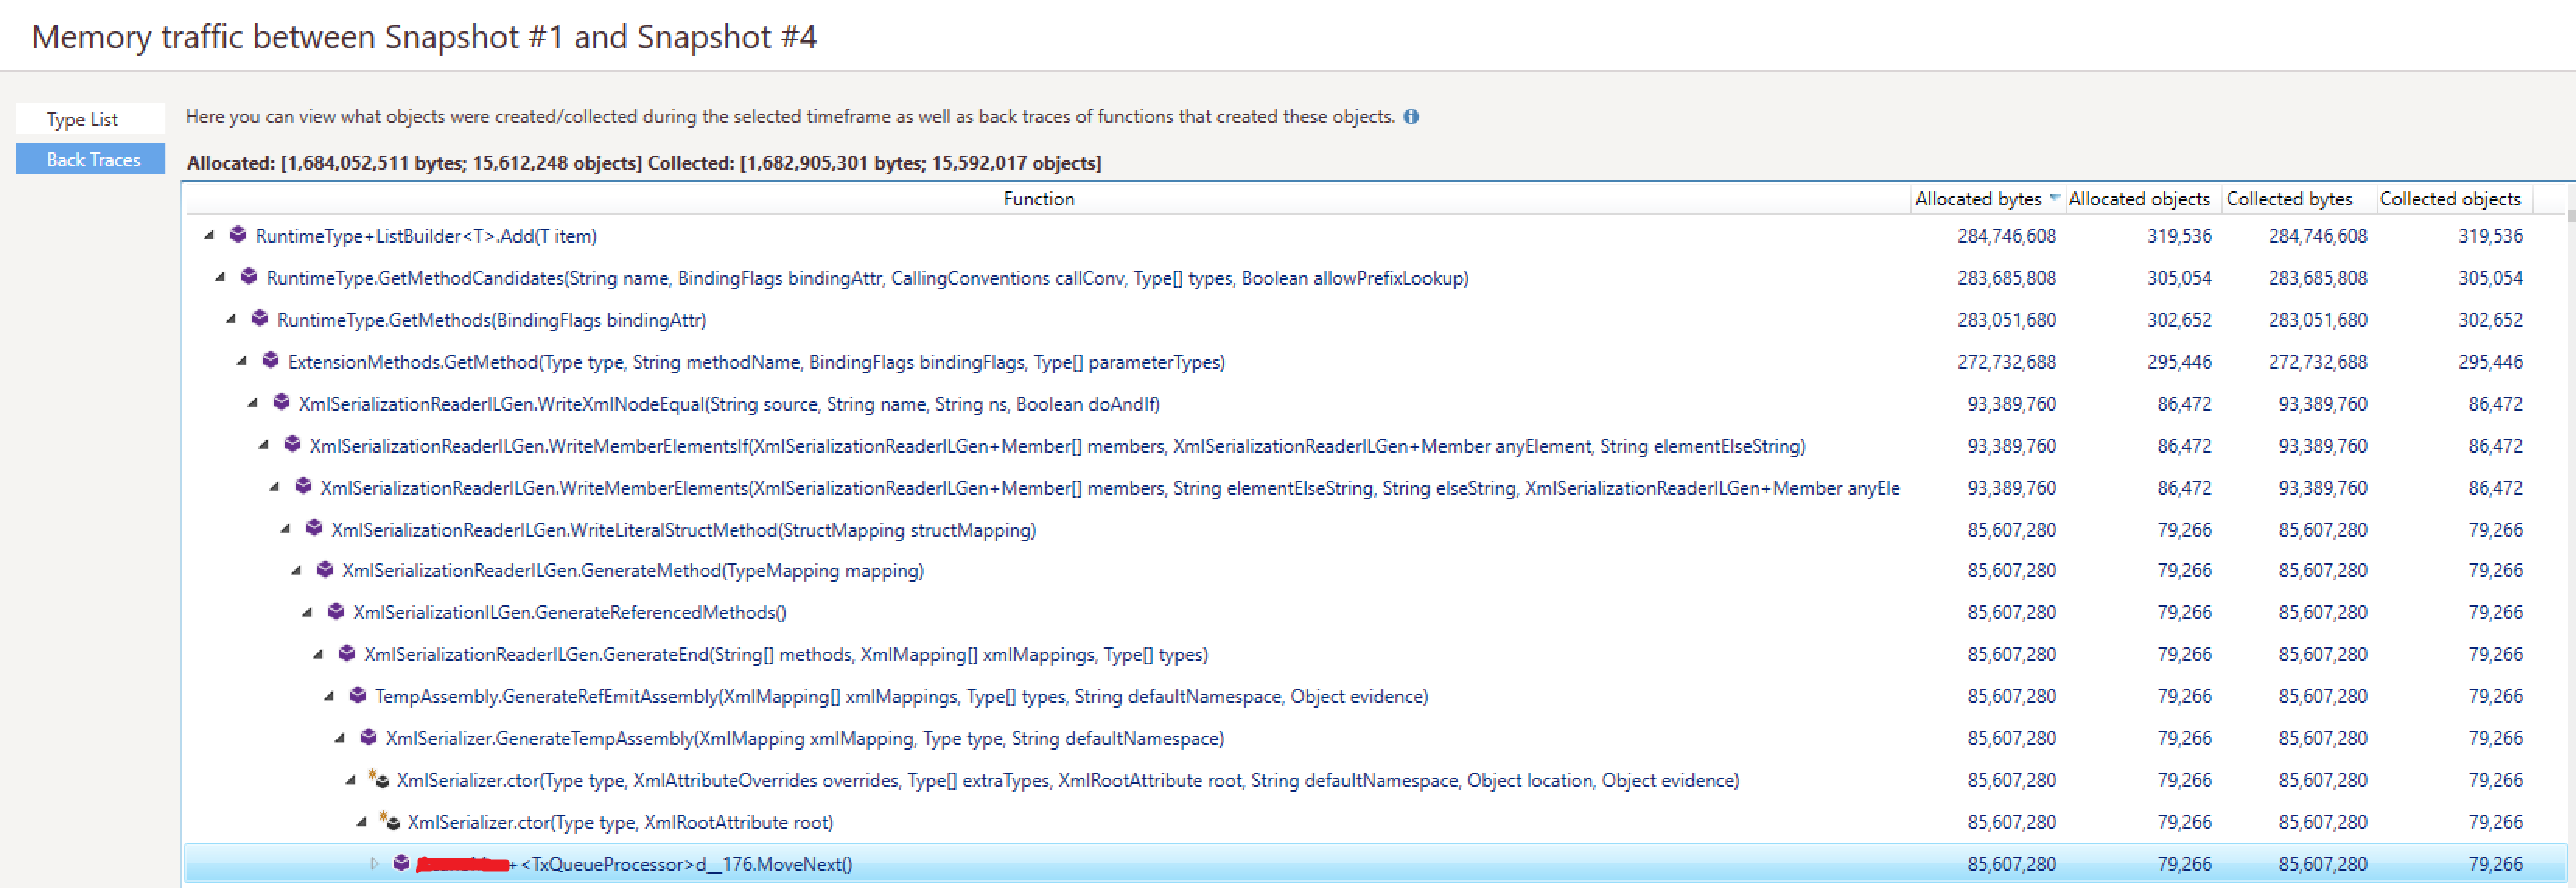
On the comparison I was a bit confused with all this information and fumbled around for a bit but we came across the Back Traces option and then picked the object with the largest amount of allocated bytes and drilled down until we saw something that might have been in my code. As we drilled down and saw system classes we knew roughly where in the app it would be until we finally hit the class and method name.
Now being a guy on the cutting edge I knew the issue I had was this new piece of technology called XML, you should try it. We looked in the code and found it was doing this, which was getting called every second.
var stream = new MemoryStream(Encoding.UTF8.GetBytes(myXml)));
var sr = new StreamReader(stream));
var serializer = new XmlSerializer(typeof(MyObject), new XmlRootAttribute("rootNode"));
var obj = (MyObject)xml.Deserialize(stream);
So did you spot it? Clue : Its not the fact that the memorystream or streamreader isn’t within a using statement (although that was fixed).
From the dotMemory data it said it was the XmlSerializer constructor. I had a look at that object and there was no Dispose method so decided I would create a static instance of it at the top of the class to save recreating it every time.
I made the changes, put them into a new docker image and watched the memory usage of my app with cAdvisor and bingo, rock solid and stable memory usage!
After a quick Google just out of curiosity, I found the same exact issue on Stackoverflow and luckily the answer was what we had decided to do with the static instance. Basically XmlSerializer uses assembly generation and they cannot be collected hence the memory issues we saw.
Anyway hope that helps you on the path to profiling your CoreCLR app and hopefully things with Jetbrains will improve so we can profile apps running on Linux.