Tracing IO in .NET Core
I was made aware of OpenTelemetry a while ago by a blog series Jimmy Bogard and put it in my favourites to read at a later date. Of course I didn’t really get back to it in depth and gave it a quick scan at the time although it is a well written in depth blog series so I suggest you do check it out. A while later I saw a blog post by Rehan Saeed which gives an introduction on what OpenTelemetry is and how it works and the concepts behind it and is definitely worth a read. At the same time I saw a YouTube video by Elton Stoneman that whilst more aimed at using tracing using Kubernetes he demonstrates a .NET app running and the tracing details appear in Jaeger
Now as some of you may be aware I have an OSS project called Carter which sits on top of ASP.NET Core and is IMO much nicer to use than MVC but still gives you everything you’d want in a web framework. I got thinking and wondered if I could take Elton’s app and convert it to work with Carter…..well of course I could, rename some Controllers here and there, remove dependencies and voila here you go!
By the time I had it all working I had discovered that the code used OpenTracing and a .NET OSS library from Christian Weiss that used and enhanced tracing data from various components in .NET. Essentially the concept of tracing data was being worked on by two groups, OpenTracing and OpenCensus. These two groups merged to create OpenTracing and become part of a wider group CNCF(Cloud Native Computing Foundation). Microsoft was already invested in OpenCensus and obviously has now moved its efforts into OpenTelemetry. To read more about the merger take a visit here.
Luckily moving the apps to use OpenTelemetry wasn’t too much work and the output is very similar to the efforts Christian had put into his library. The new codebase can be found on my main branch in the repo.
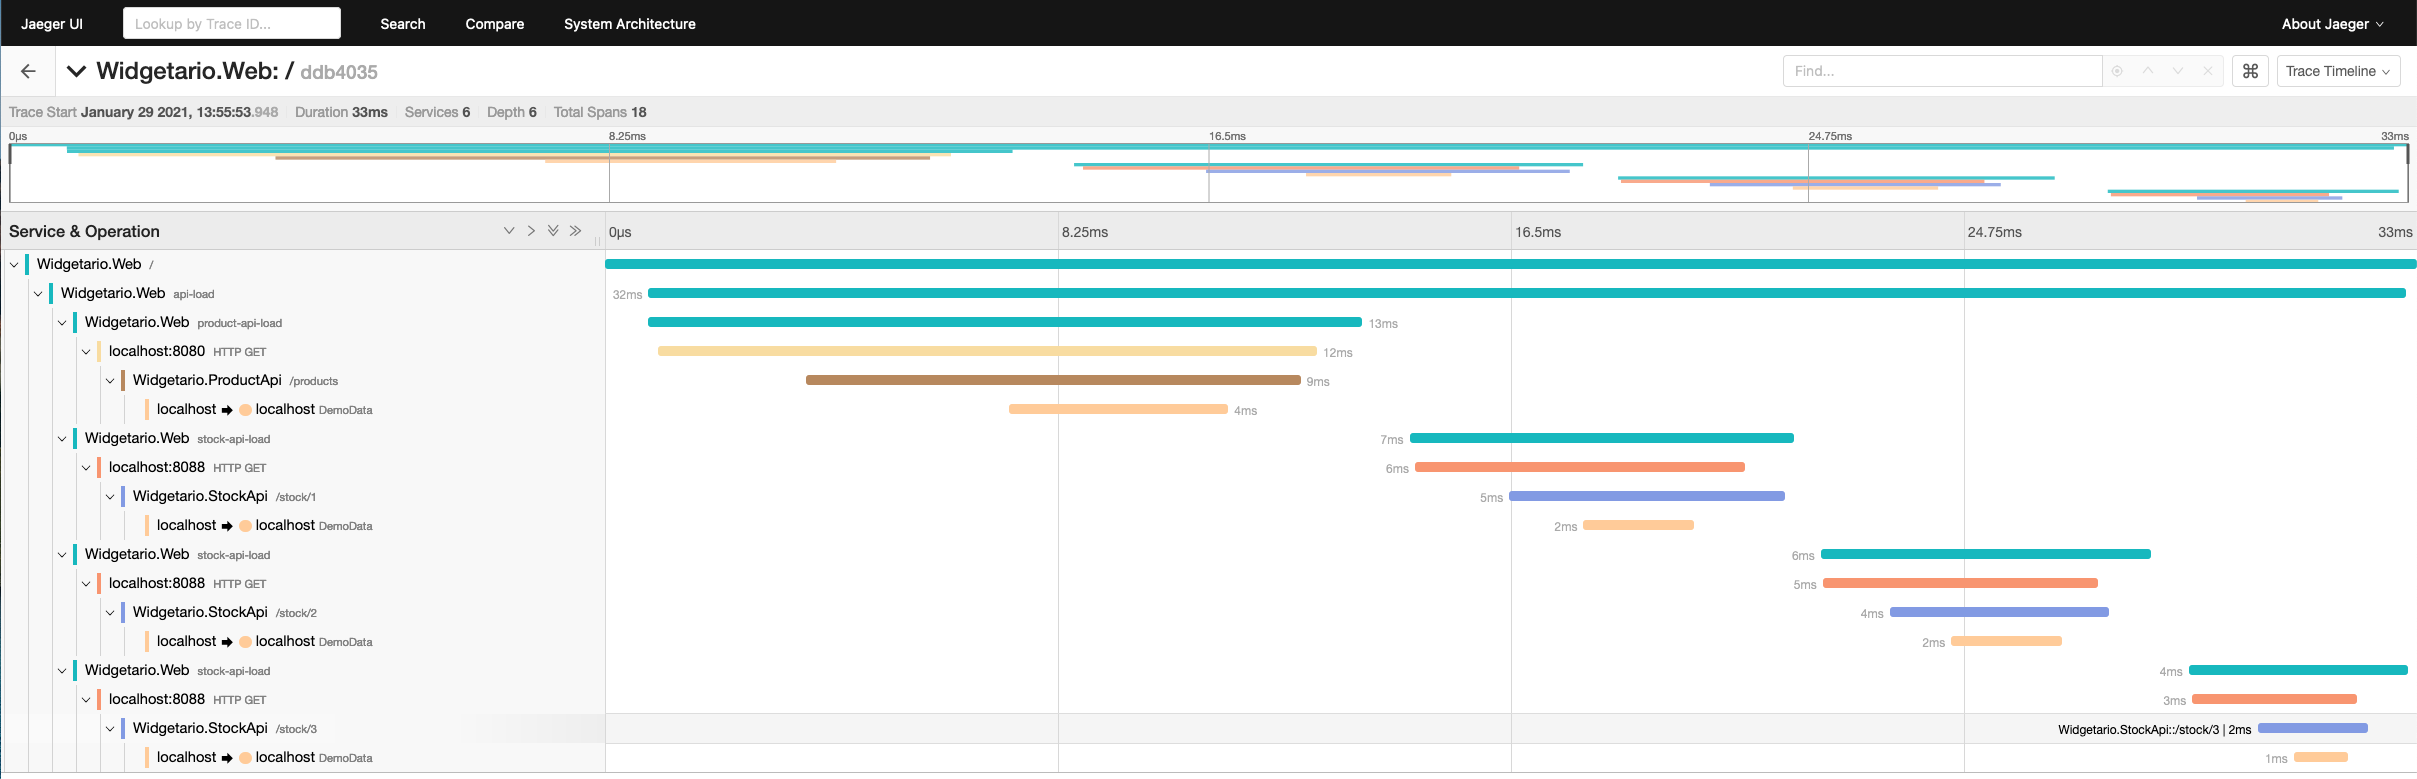
What the apps consist of is a web app which is the entry point that lists products and their stock quantities. When making a request to the root of the web app it subsequently calls a products API and then for each product it makes a call to get the stock. From the screenshot above you can see we have 3 products as there are 3 requests to the stock api.
If we look a bit further we can see that OpenTelemetry allows us to see HTTP requests going out of our app and into our other API to get the data:
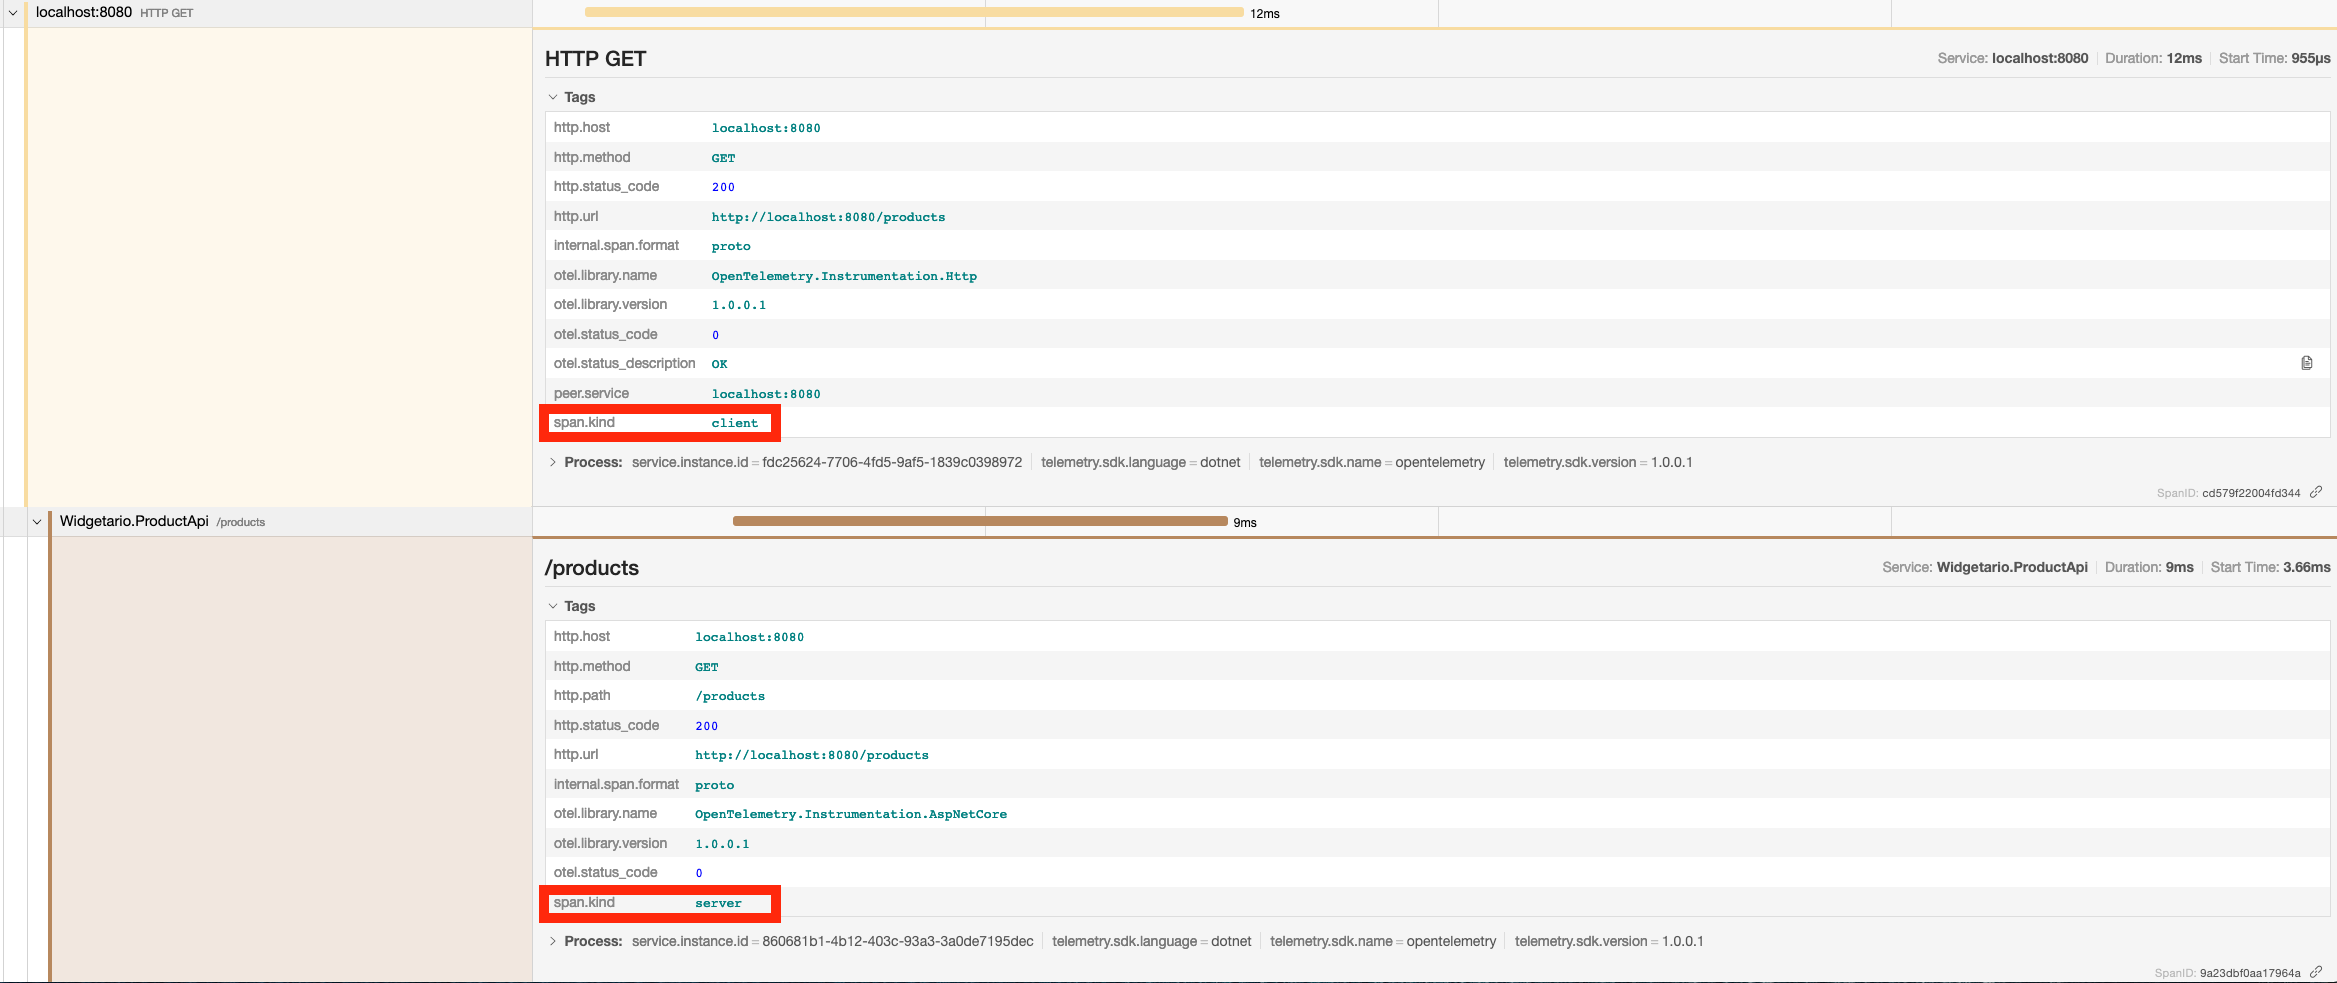
One is the client making the request and the other is the server responding with a 200 response.
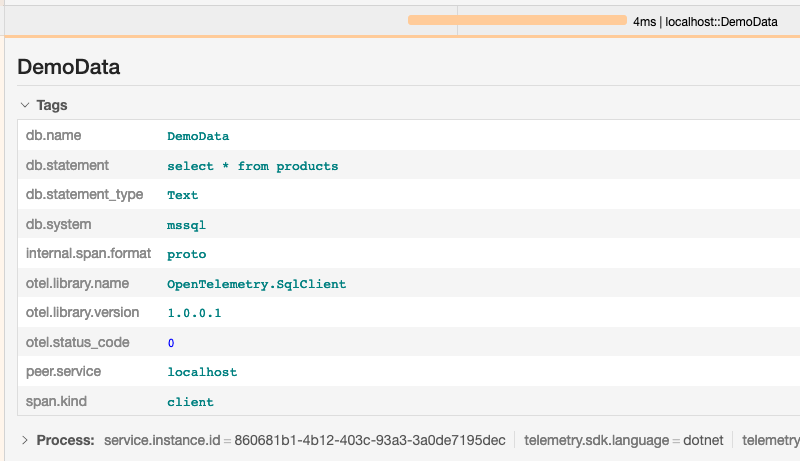
If you look at the main screenshot we can delve a bit deeper as there is something marked as DemoData. This is the name of our database. If we click this we can get an overview of the SQL statement and how long it took to return data:
Now at this point I hope you’re suitably impressed but I can hear you asking what’s the effort to get all this information? Am I going to have litter my codebase with lots of objects tracking IO calls? Well let’s take a look at the HTTP server implementations of getting the products:
this.Get("/products", async (req, res) =>
{
    var products = await productsRepository.GetProducts();
    await res.AsJson(products);
});
So it accepts the request, invokes the product repository to get the data writes this to the HTTP response. Hmm, no tracing code. Ok it must all be wrapped in the SQL logic:
public async Task<IEnumerable<Product>> GetProducts()
{
    using var connection = new SqlConnection(this.connectionString);
    return await connection.QueryAsync<Product>("select * from products");
}
Nope no tracing there either!
So the tracing code is done at Startup and that’s it:
public void ConfigureServices(IServiceCollection services)
{
    services.AddCarter();

    services.AddTransient<ProductsRepository>();

    if (Configuration.GetValue<bool>("Tracing:Enabled"))
    {
        services.AddOpenTelemetryTracing(builder =>
            builder
            .SetResourceBuilder(ResourceBuilder.CreateDefault().AddService("Widgetario.ProductApi"))
            .AddAspNetCoreInstrumentation()
            .AddSqlClientInstrumentation(sqloptions => { sqloptions.SetTextCommandContent = true; })
            .AddJaegerExporter());
    }
}
When a request is made into our products API and it hits the database the .NET underlying types emit tracing data that can be exported to a number of different tools. This can be AWS, GCP, Azure, Prometheus, Akka, Elasticsearch, DataDog, GraphQL, gRPC and pretty much anything else you can think of. To note, OpenTelemetry is not a .NET thing, it is a cross platform, cross language standard for tracing data in applications and services.
If you’re still not convinced there isn’t more to this lets take a look at the web app in our solution Startup code:
public void ConfigureServices(IServiceCollection services)
{
    services.AddCarter();
    services.AddScoped<ProductService>();
    services.AddScoped<StockService>();

    if (Configuration.GetValue<bool>("Tracing:Enabled"))
    {
        services.AddOpenTelemetryTracing(builder =>
            builder
                .SetResourceBuilder(ResourceBuilder.CreateDefault().AddService("Widgetario.Web"))
                .AddSource("api-load-source")
                .AddAspNetCoreInstrumentation()
                .AddHttpClientInstrumentation()
                .AddJaegerExporter());
    }
}
The only thing different here is that we have a line to add HTTP instrumentation rather than SQL instrumentation. You may notice we have a line about adding a source. This is purely if you want to write extra data or enrich the info you see in the Jaeger UI. If you look back to the main screenshot you’ll see some annotations called api-load and stock-api-load which gives me a bit more of a clue to where this code is executed in my app. This does add a bit more code to your app but it’s purely optional:
this.Get("/", async (req, res) =>
{
    var stopwatch = Stopwatch.StartNew();
    logger.LogDebug("Loading products & stock");
    var model = new ProductViewModel();

    using (ActivitySource.StartActivity("api-load"))
    {
        using (ActivitySource.StartActivity("product-api-load"))
        {
            model.Products = await productsService.GetProducts();
        }

        foreach (var product in model.Products)
        {
            using (ActivitySource.StartActivity("stock-api-load"))
            {
                var productStock = await stockService.GetStock(product.Id);
                product.Stock = productStock.Stock;
            }
        }
    }

    logger.LogDebug("Products & stock load took: {@Time}ms", stopwatch.Elapsed.TotalMilliseconds);

    await res.AsJson(model);
});
We use a static object called ActivitySource created earlier in the class like so: private static readonly ActivitySource ActivitySource = new ActivitySource("api-load-source"); and each time we want to add some data to our HTTP calls we call StartActivity with a name of out choosing and it then appears in our Jaeger UI.
One thing to note is that the ILogger data does not appear in our OpenTelemetry data. They consider this a separate thing altogether from tracing as well as metrics, all three are very different. That said I did mention it in the OpenTelemetry gitter room and they have raised a Github issue to implement support for this so maybe in time you’ll be able to see your logs and your telemetry data side by side. Interestingly this was a feature in Christian’s OSS library that used OpenTracing before I moved to OpenTelemetry.
Anyway I hope this has been an interesting introduction into OpenTelemetry and shown you how we can simplify and expose tracing data within .NET so we can keep an eye on the performance of the IO in our apps!